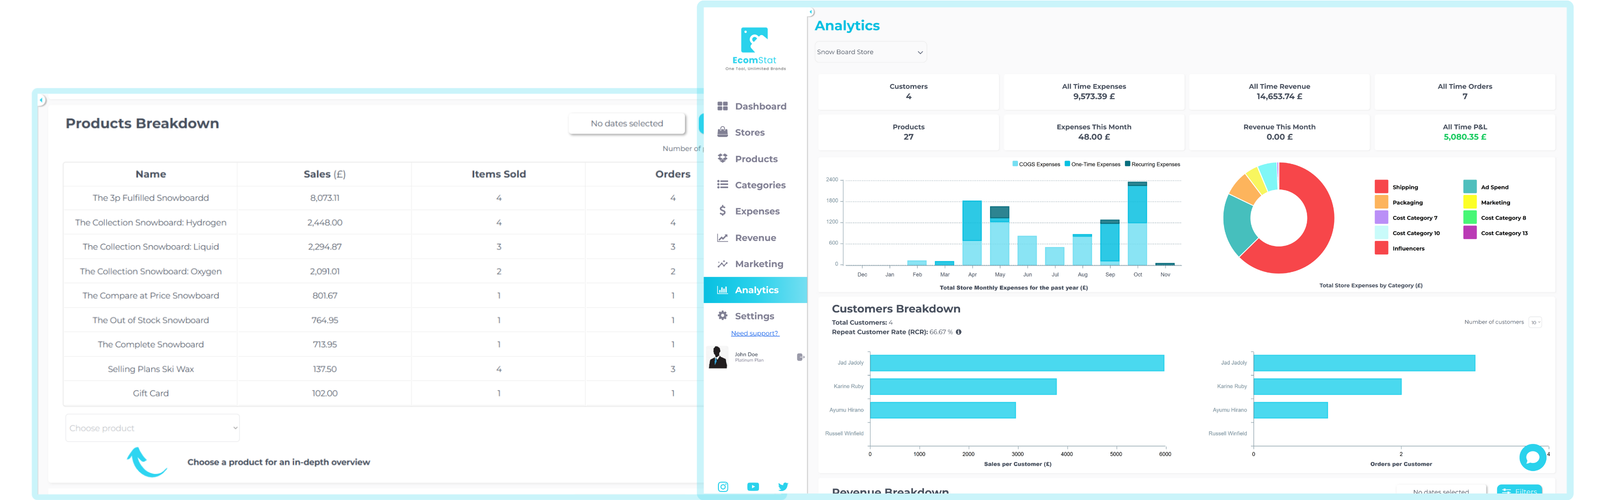
Sales live in Shopify. Advertising spend lives in your ad account. Product costs and subscriptions may sit in separate spreadsheets. Each tells you something useful, but none gives you the whole picture on its own.
Start with a consistent view A useful dashboard brings revenue and costs together for the same period. Before comparing results, check that your date ranges, currencies and definitions line up. Otherwise, a difference in reporting can look like a change in performance.
Look at costs alongside sales A busy sales day can also be an expensive day. Advertising, product costs, shipping and recurring expenses all affect how much of your revenue stays in the business.
- Keep product costs up to date.
- Connect advertising spend where supported.
- Account for recurring business expenses.
- Review refunds and any costs recorded outside your store.